Insights Central Hub
TIMELINE
Jun 2024 – Oct 2024
ROLE
Product Designer
The Situation
A business unit within a tech conglomerate had launched an internal Productivity Insights Dashboard. Adoption flatlined at 5%. Engineers, who live entirely within their IDE, saw analytics as a distraction, not a tool. Managers lacked quick visibility into team health or delivery risks. Our mission: make data indispensable by surfacing only "need-to-know" insights that immediately grab attention and drive action.
An engineer's day starts and ends with the IDE. They have no need, and would never open another window, for nothing useful to them.
—Product Owner
The Problem
- Undefined Needs at Scale
Even product owners admitted they had no clue what would make this product useful. The previous dashboard was built on assumptions, not observed behavior. - Zero Initial Adoption
Engineers viewed analytics as "management overhead," not personal value. Grafana existed for testing stats but sat unused for the same reason: it required leaving their workflow to interpret data they didn't see as actionable. - Attention Scarcity
Developers engage only with tools showing instant, personal value. Managers needed high-level summaries and clear next steps, not raw metrics to parse.
The Vision
An insights dashboard that becomes integral to the development workflow, providing actionable, contextual intelligence for both developers and managers. A tool engineers would actually want to use because it saves them time and prevents mistakes, not because they were told to.
Designing the Experience
1. Uncovering Latent Needs
I started with the obvious: we had to talk to users. Client PICs connected me with 20+ engineers and 10+ managers. The initial response was skeptical, everyone agreed the goal was "probably impossible," but they were willing to help.
Critical research tactic: I explicitly told engineers to ignore feasibility. "Don't worry about whether it's possible, just tell me what you wish you knew while coding." This unlocked honest insights; their technical minds usually self-censor into "how" before articulating "what."
Key discoveries:
- Engineers didn't want "productivity metrics", they wanted pre-commit risk detection (what am I about to break?) and post-commit impact validation (what actually happened after I pushed?)
- Managers didn't want more charts, they wanted narrative summaries and prioritized action items they could delegate
The surprise: Once engineers articulated their needs without filtering for feasibility, we discovered most requests were already achievable with existing internal tools and libraries. The "impossible" problem was actually a communication barrier, not a technical one.
2. Synthesizing Requirements into Use Cases
I distilled findings into two distinct mental models:
Developer Stories:
- Post-commit analytics (what happened)
- Pre-commit risk indicators (what might break)
- Real-time pipeline status
- File-level defect attribution
Manager Stories:
- Team velocity trends
- SLA compliance tracking
- Feature delivery forecasting
- Sprint readiness assessment
Each use case received an ID (ICH-001, ICH-002...) to streamline backlog management across multiple squads and maintain traceability from insight to feature.
3. Defining Information Architecture
We rejected a single "flexible" interface, engineers and managers have incompatible mental models. Instead, we built two distinct experiences under one navigation:
Manager View:
- Tab 1: Overall Metrics & Recommendations (team health at a glance)
- Tab 2: Component & Feature Stats (drill-down into specific delivery risks)
Developer View:
- Tab 1: Overall Metrics & Recommendations (post-commit personal impact)
- Tab 2: Work-in-Progress (pre-commit risk analysis)
This prevented the "compromised middle" where neither audience feels served.
4. Key Design Decisions
Before visual design, we established four principles that shaped every screen:
Progressive Disclosure Architecture
Engineers resisted context-switching. The "Work-in-Progress" view analyzes uncommitted code locally, surfacing risk indicators without server transmission, addressing usability, security, and latency concerns simultaneously.
Narrative-First Data Presentation
Raw metrics failed in testing; engineers skipped charts. Auto-generated natural language summaries ("Your statistics reflect...") interpret data automatically, reducing cognitive load and preventing misinterpretation.
Actionable Over Informational
Every insight connects to specific action with quantified impact. "63% code coverage" becomes "Improvable to 82% with 5 recommended test scripts", transforming awareness into execution and ensuring the tool drives behavior change, not just data consumption.
Dual Mental Models
Splitting Manager/Developer views prevented design-by-committee compromises. Managers get strategic narrative; developers get tactical code-level intelligence. Neither audience is forced to translate the other's language.
5. Design & Validation
I worked atomically from use cases upward, ensuring no crucial details were lost while maintaining natural hierarchy. Visual language decisions were deliberate: we replicated patterns from Grafana (for testing familiarity) and IDE linting tools (for immediate recognition), but transformed the utility from "information display" to "actionable intelligence."
Four-phase validation cycle:
- Data analysis: Raw use case data modeled in Grafana, Excel, and PowerBI to determine optimal visualization strategies
- Wireframing: Layout and navigation tested with PICs for hierarchy clarity
- High-fidelity UI: Designs populated with actual production data to ensure readability
- Bi-weekly validation: Two-day feedback cycles with PICs to catch misalignment early
Final Solutions & UI
A. Manager View: Overall Metrics & Recommendations
For managers who need team health in 30 seconds
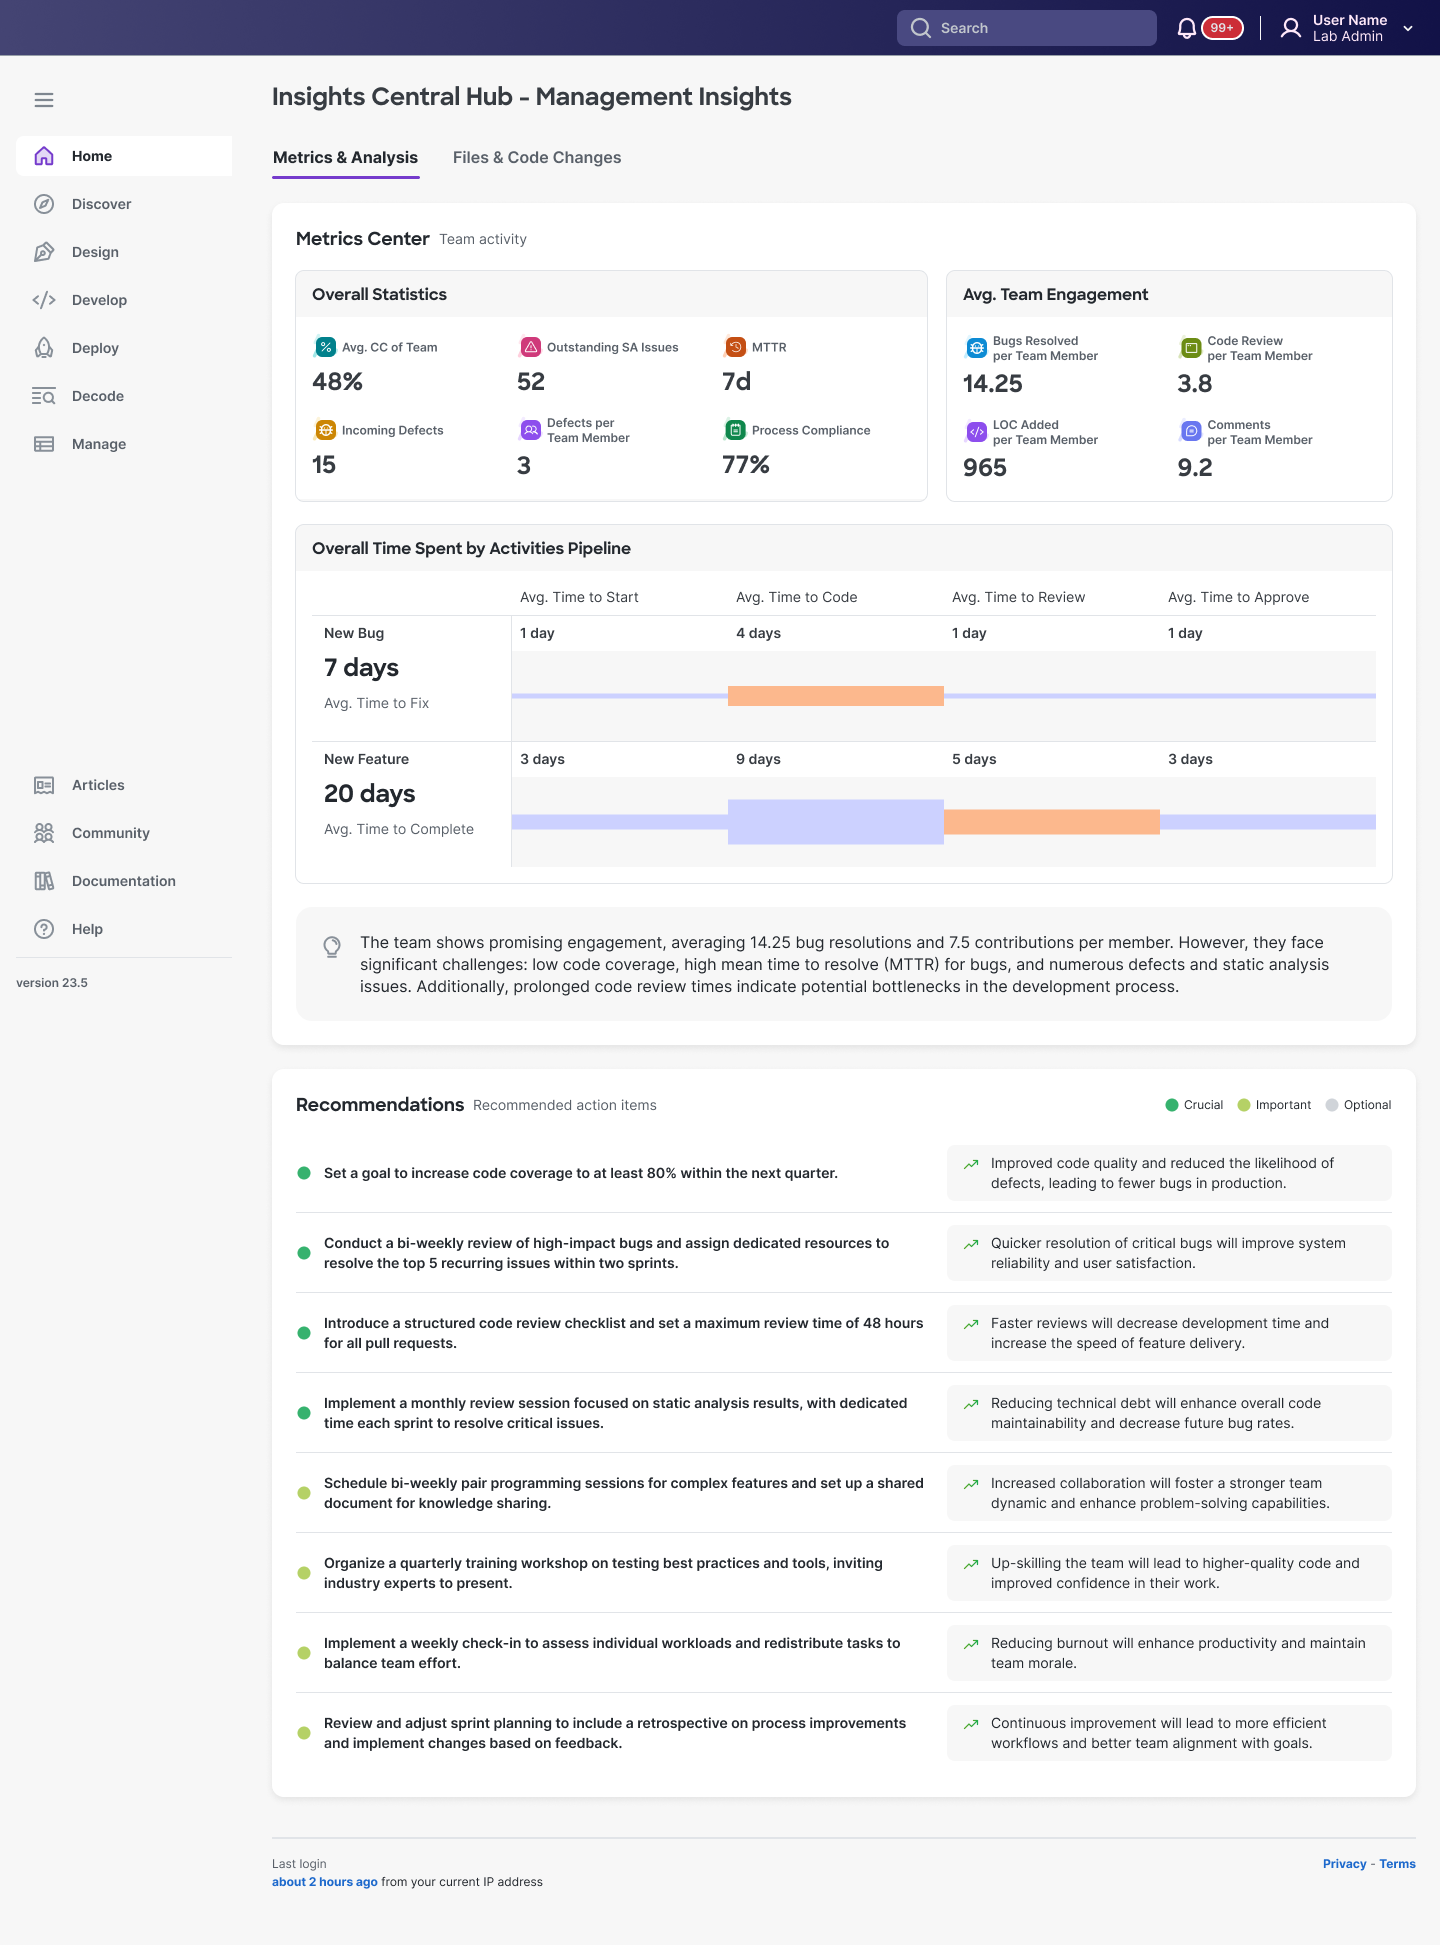
Design rationale:
- Glanceable hierarchy: Color-coded statistics: 48% avg CC, 52 outstanding issues, defects...
- Narrative summary: Auto-generated interpretation ("The team shows promising engagement...") eliminates chart-parsing time
- Prioritized actions: Recommendations tiered as Crucial/Important/Optional with specific targets and business outcomes, not vague advice
B. Manager View: Component & Feature Delivery Stats
When drilling into specific delivery risks
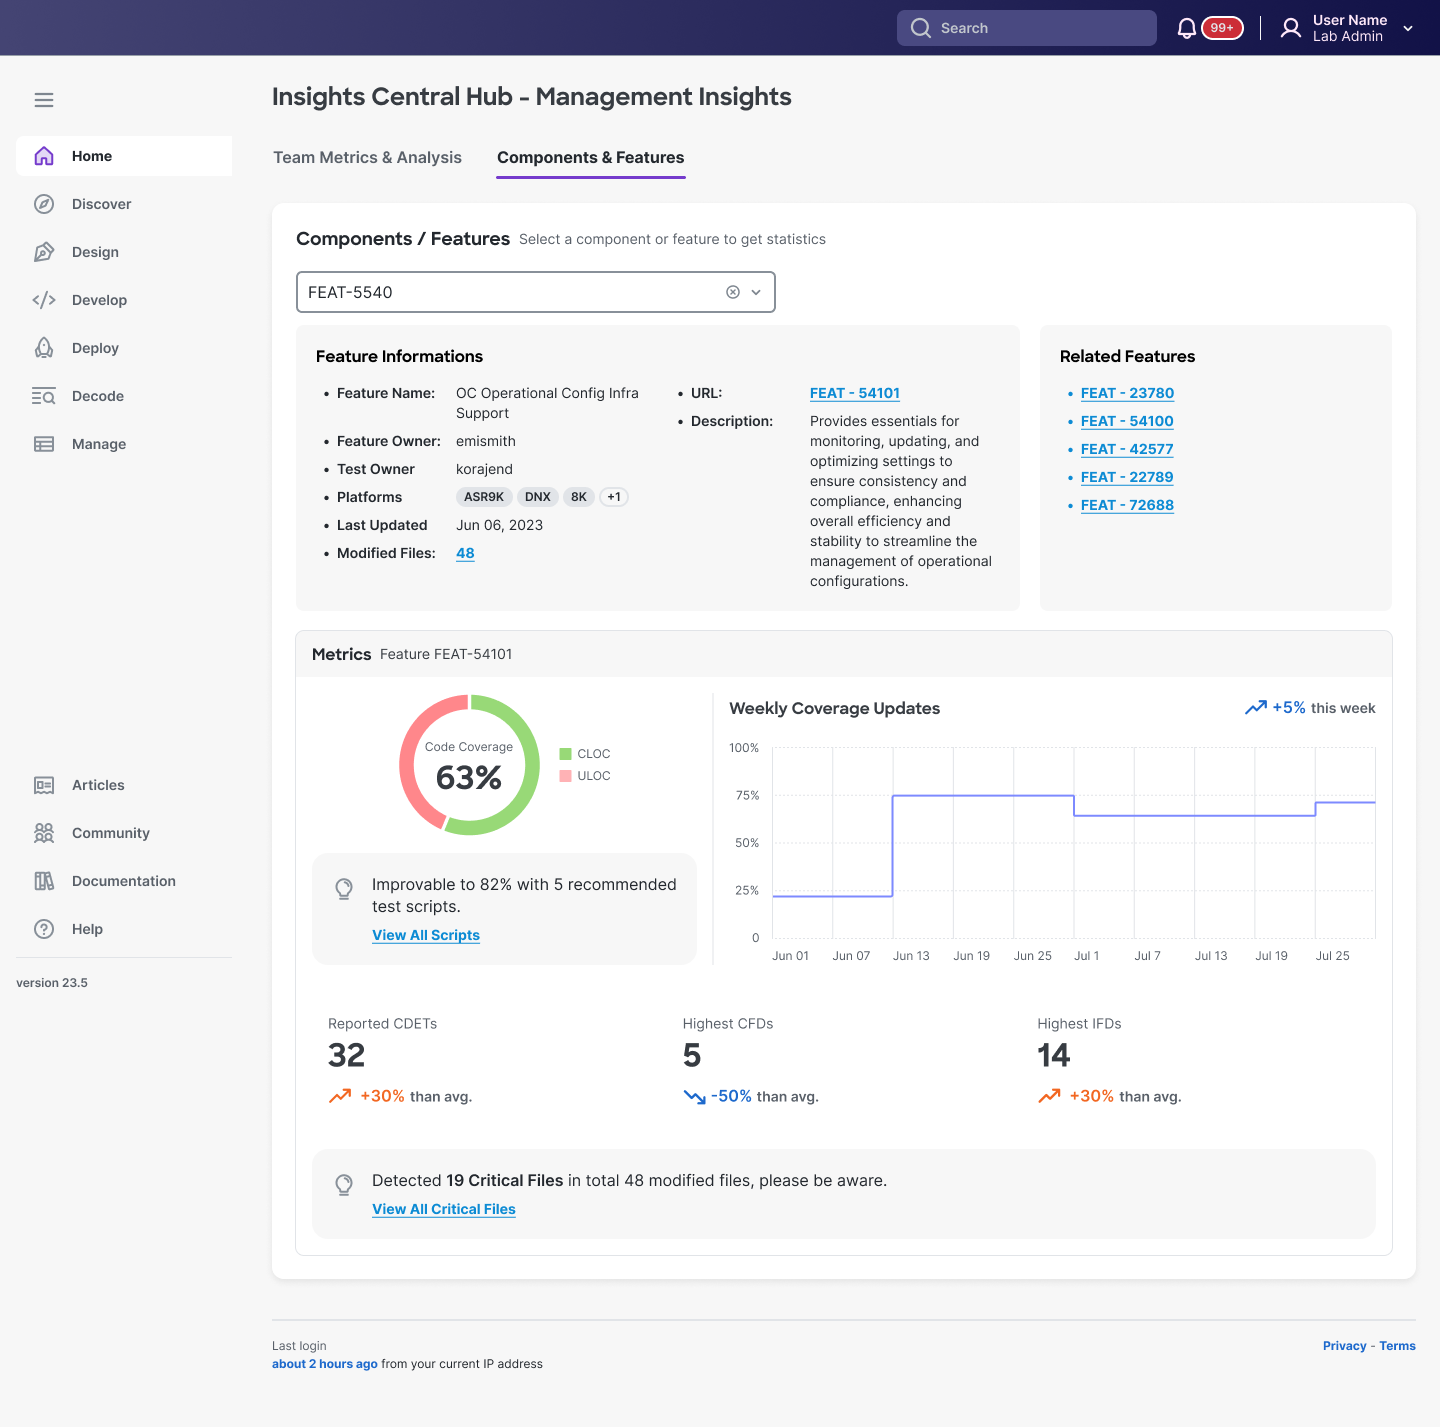
Design rationale:
- Feature-centric organization: Search by feature ID matches how managers track work
- Risk quantification: Code coverage immediately contextualized with improvement path (Recommended test scripts)
- Anomaly flags: "19 Critical Files in 48 modified files" surfaces specific investigation targets without manual analysis
C. Developer View: Post-Commit Insights
For developers reviewing their impact
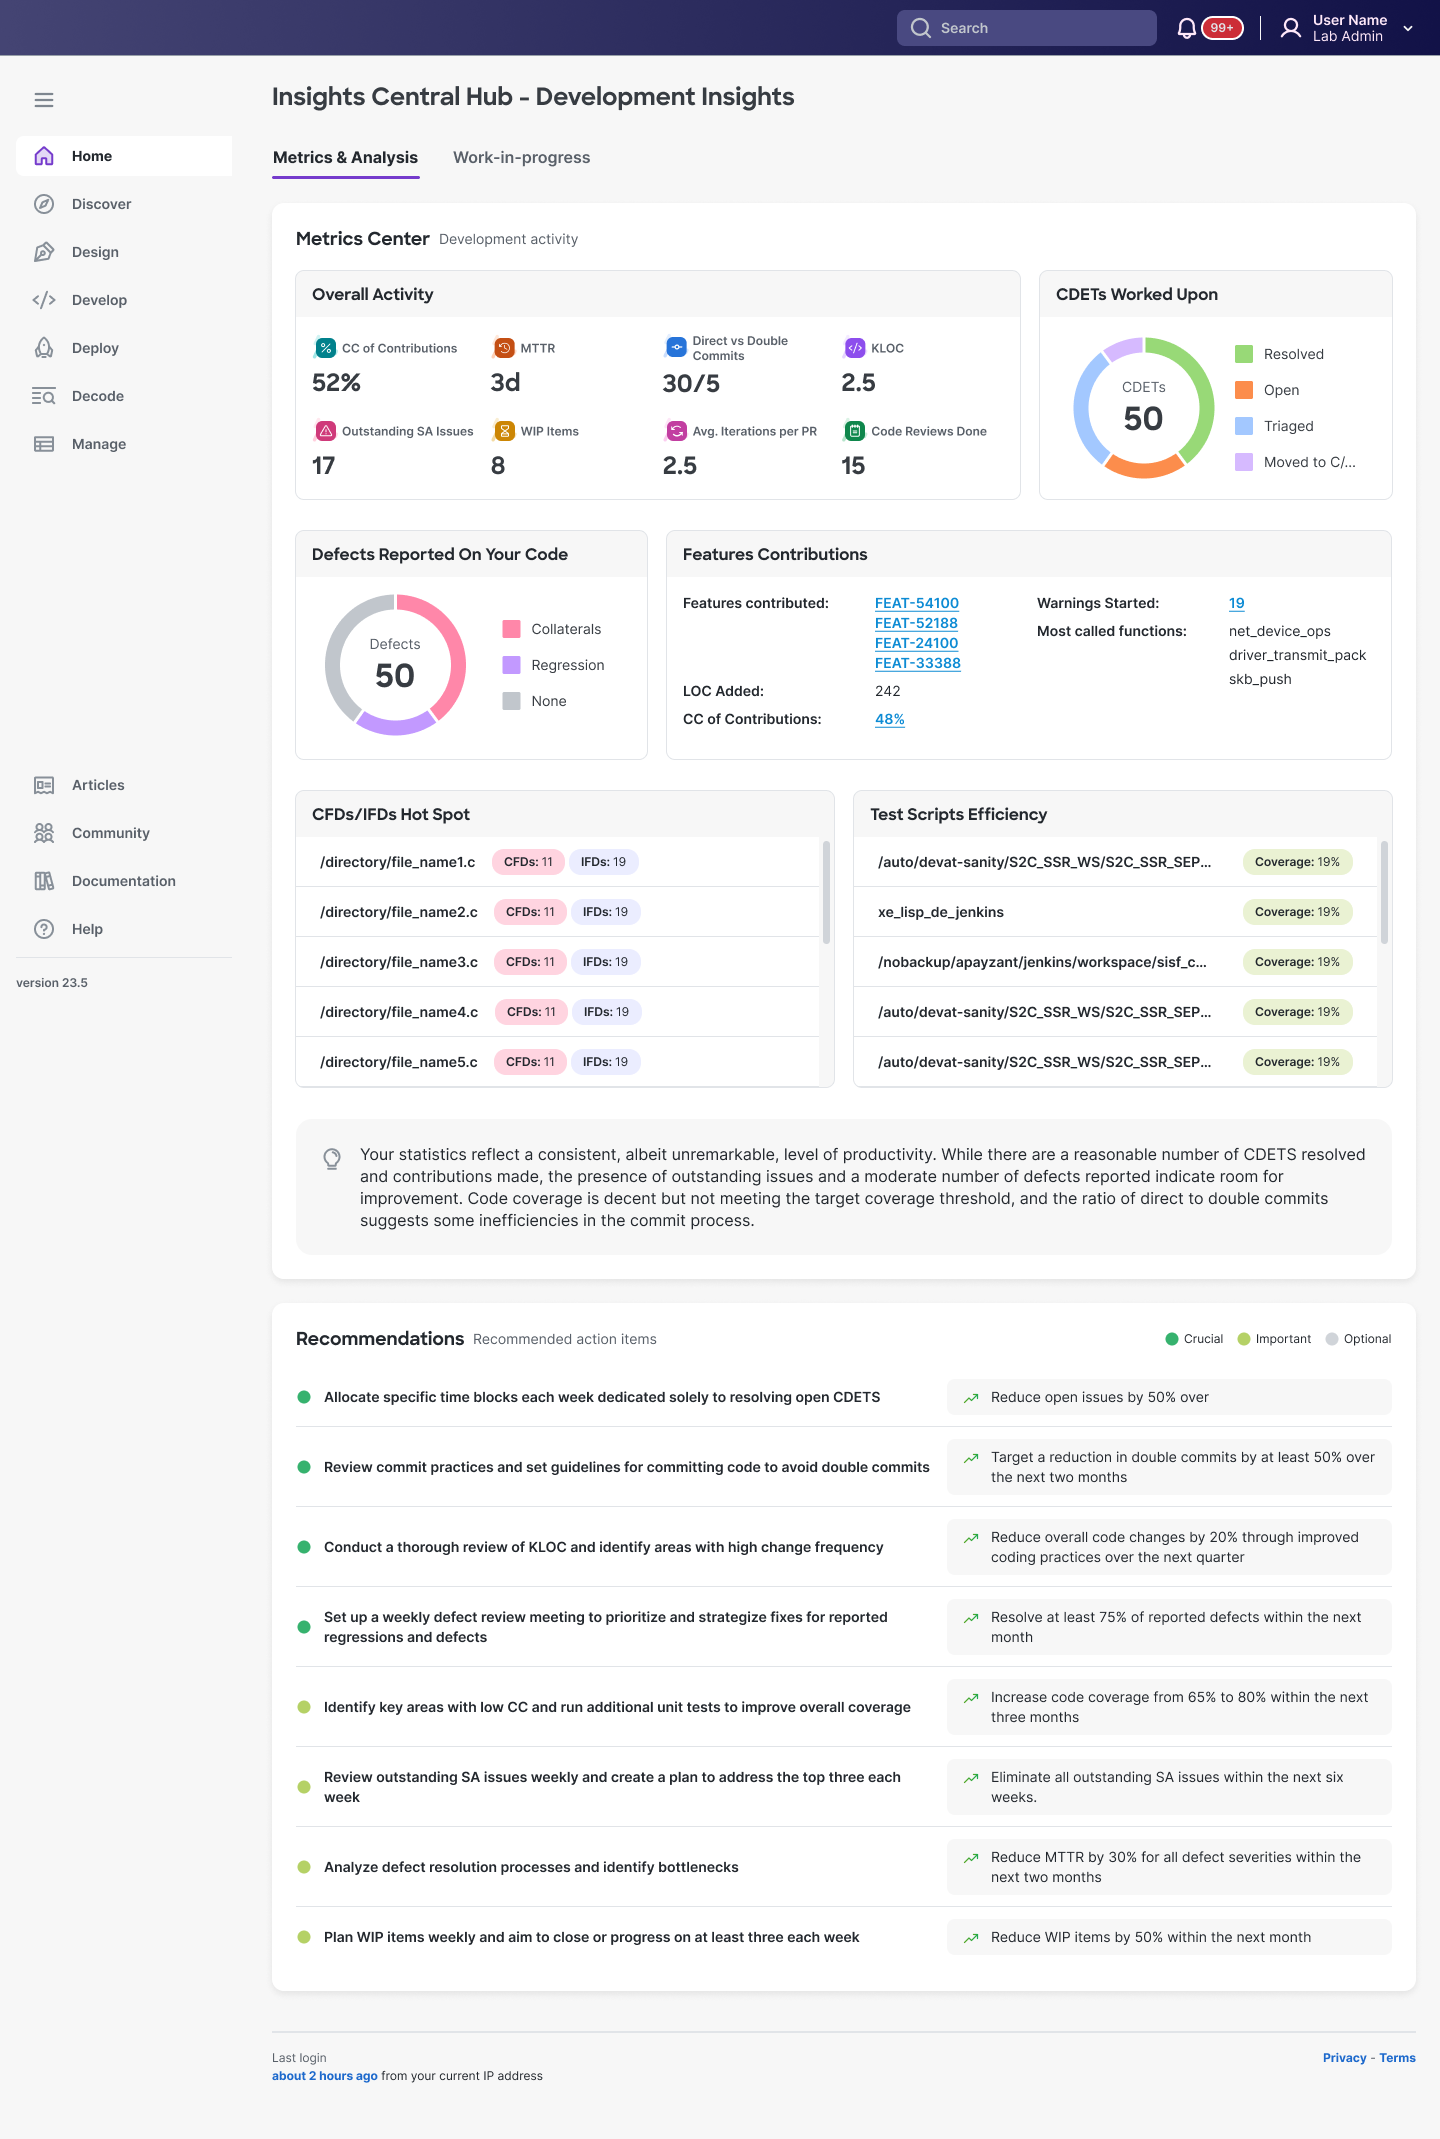
Design rationale:
- Personal metrics front-loaded: all individual accountability shown such as: "Defects Reported On Your Code", "Features Contributions," "CDETs Worked Upon"...
- IDE-adjacent patterns: File paths, code review counts, and commit stats mirror tools they already use
- Auto-generated coaching: Summary paragraph interprets their statistics and suggests specific improvements
D. Developer View: Work-in-Progress (Pre-Commit Insights)
The game-changer: preventing problems before they happen
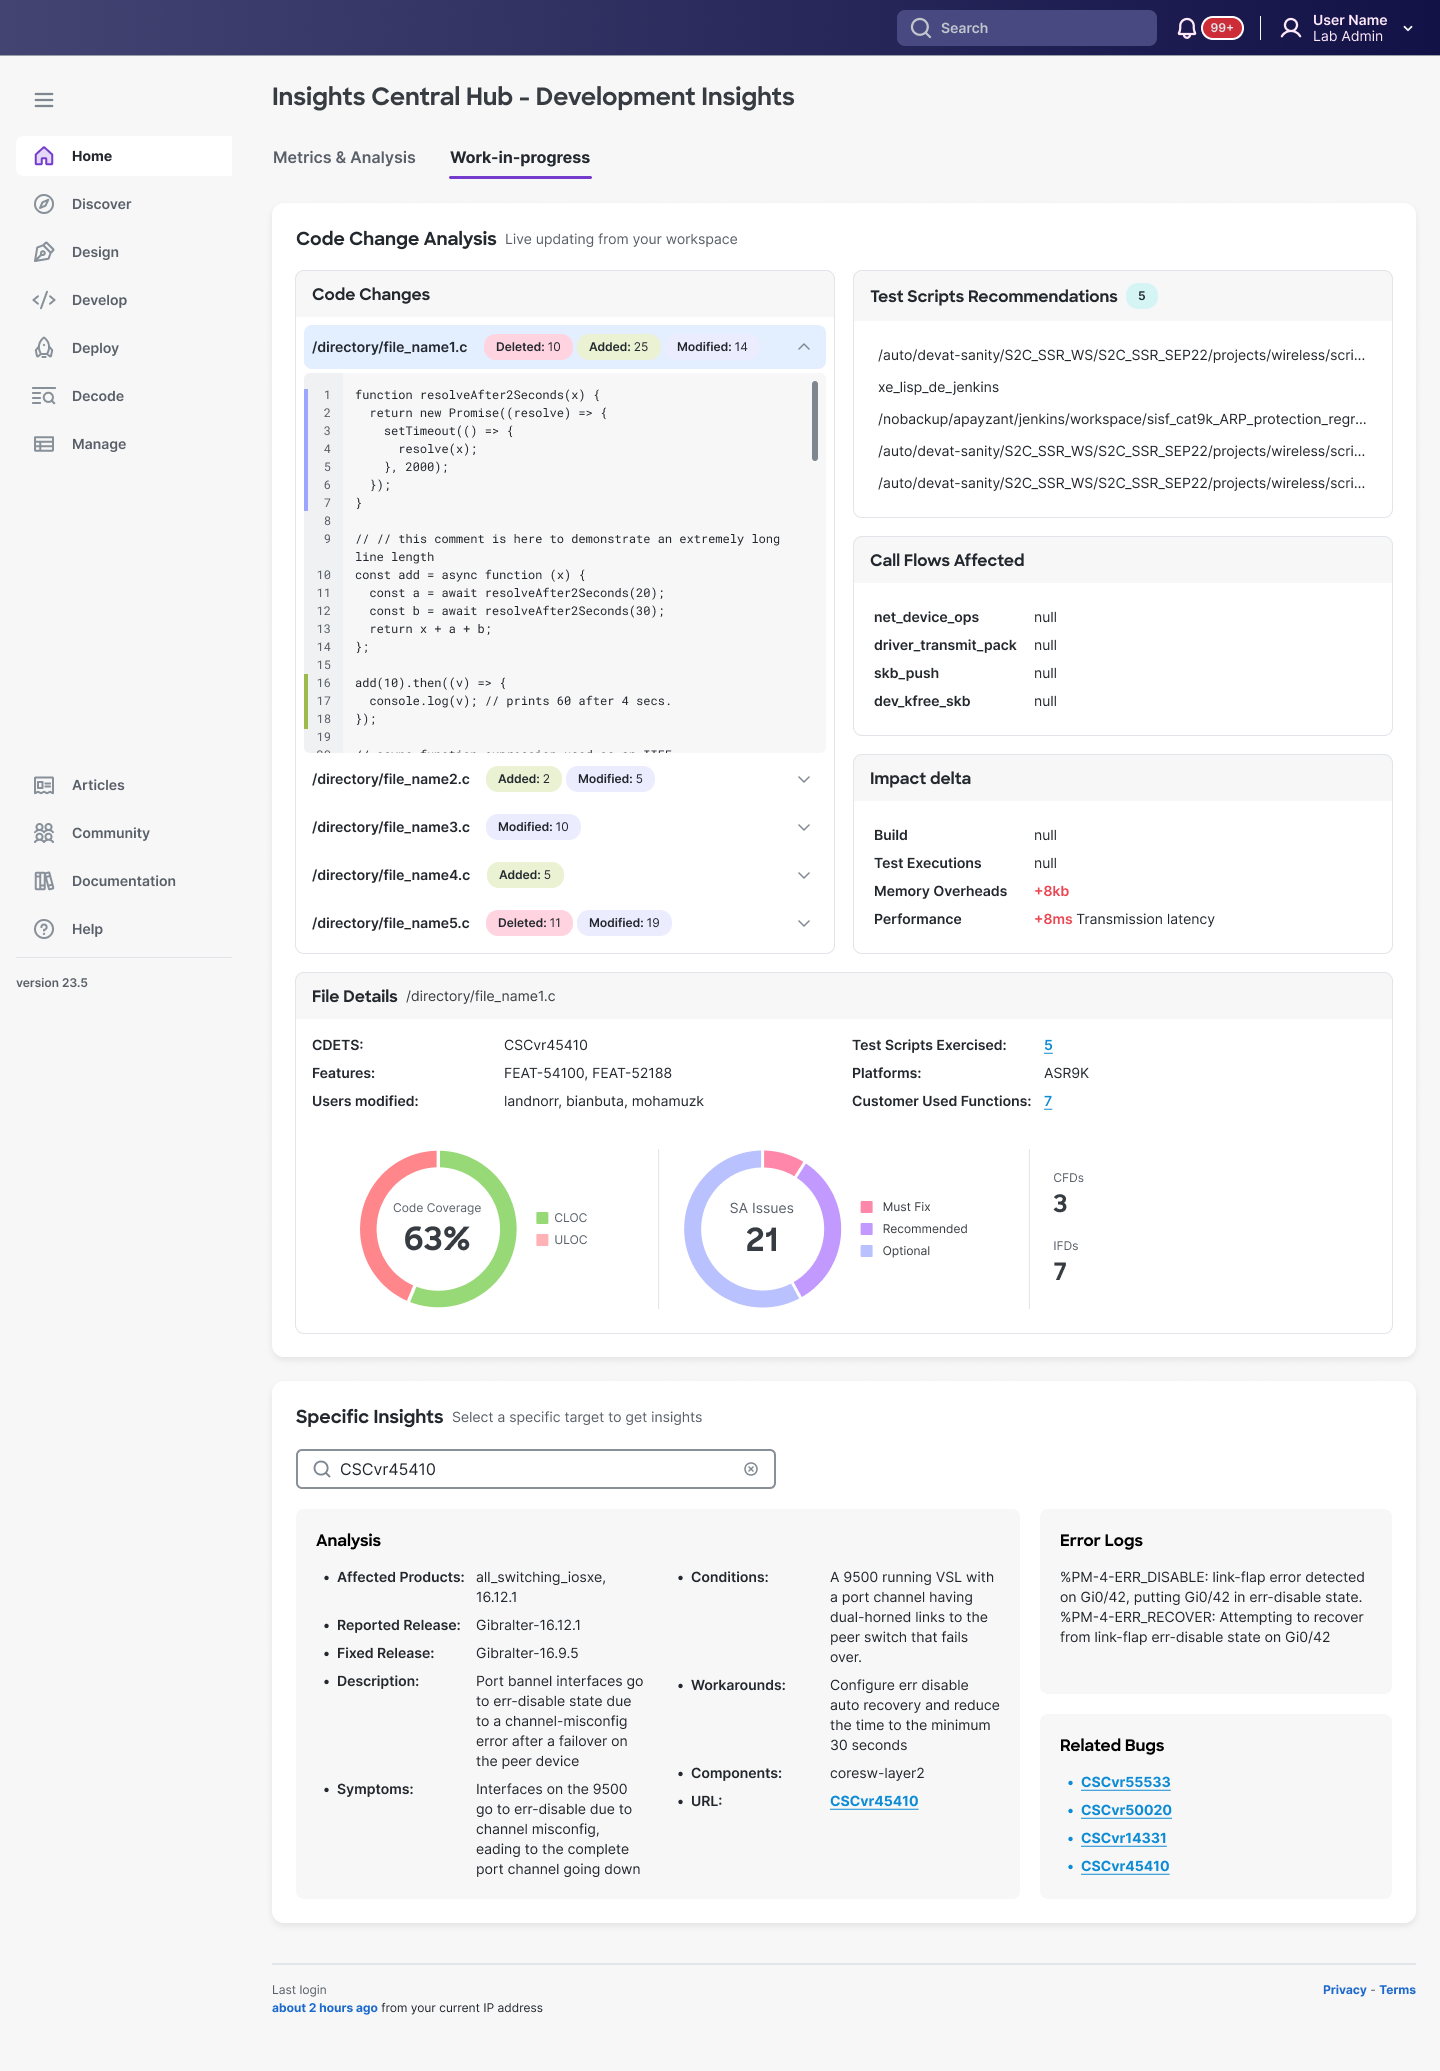
Design rationale:
- Live code analysis: Uncommitted changes analyzed locally with file-level diff visualization
- Predictive intelligence: "Impact delta" quantifies risk before commit
- Actionable prevention: Test script recommendations auto-generated from affected code paths, "Call Flows Affected" shows blast radius, and "Specific Insights" provides error logs + workarounds at file level
- Workflow integration: Surfaces exactly what engineers previously had to hunt across multiple tools or discover post-failure
Results & Outcomes
Within the first month of launch:
- 🚀 70% increase in daily active usage among engineers (from 5% to 75%)
- 📊 100% of managers adopted for productivity monitoring and sprint planning
- 👍 64% satisfaction score in post-launch survey across both roles