Digitalizing & Streamlining School Bus Operations
TIMELINE
Aug 2023 - Mar 2025
ROLE
Design Lead && Client Contact Point
The Situation
School bus operators on client side, based in Singapore, had no real‐time visibility into their fleet. Routes were manually monitored via radio check‑ins and paper logs, leading to delayed responses when issues arose. Parents likewise had no way to know where their children’s buses were at any given moment. After evaluating several off‑the‑shelf solutions (none of which fit the client’s unique routing, safety, and reporting needs), they partnered with us to digitalize their platform, starting with live tracking and incident management. This case study mainly focus on the live tracking and incident handling features of the platform. The project was a collaboration between our design team and the client’s operations, safety, and engineering teams.
The Problem
- Zero Real-Time Visibility
No centralized map: dispatchers couldn’t see which buses were delayed, idle, or experiencing incidents. - No Incident Workflow
When a bus accident or unexpected stop occurred, the only recourse was a phone call and by then, precious minutes had passed. - High Stakeholder Anxiety
Parents and school admins demanded instant reassurance but had no live data feed.
The Vision
A web‐first dashboard that empowers dispatchers to:
- See the entire fleet live at a glance
- Filter & search by bus plate for focused monitoring
- Toggle on traffic overlays to advise drivers
- Drill into incident workflows for rapid resolution
“We need live signals, not guesses, so we can react immediately.”
—Head of Safety & Compliance
Designing the Experience
1. Deep Client Collaboration
To digitalize gracefully, I spent countless hours in iterative workshops:
- Requirements workshops with dispatch, safety teams, and parent‐liaison officers
- Wireframe reviews: rapid sketches → Figma wireframe → client feedback
- Feasibility check‑ins with engineers to align on GPS API and real‐time data streams
Patient back‑and‑forth kept everyone aligned and built trust that we could solve their unique challenges.
2. Information Architecture
Focused on two primary user goals:
- “Where is my fleet?” ⇒ Global map, status cards
- “What incidents need attention?” ⇒ Incident stats + resolution tools
I structured the nav to be the following:
Home Dashboard ⇒ Live Tracking ⇒ Incident Handling
Final UI Flows & Screen Placeholders
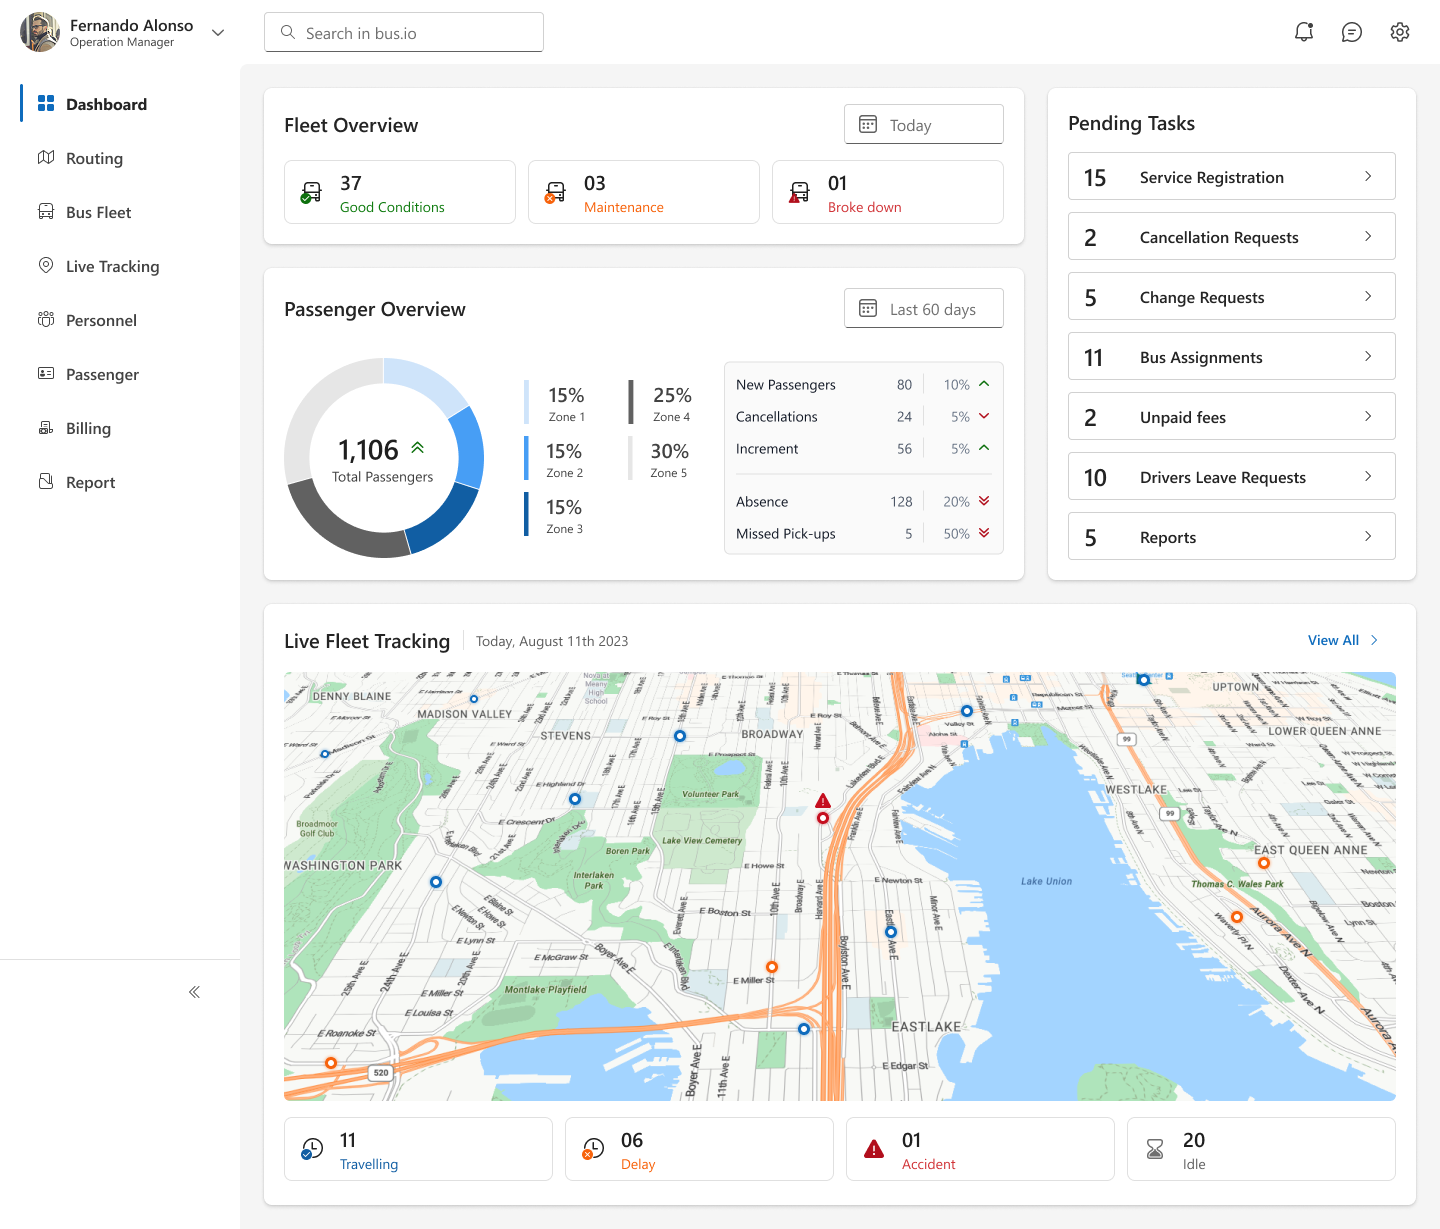
A. Home Dashboard
A birds‐eye view of:
- Passenger statistics (on‑board counts)
- Fleet statistics (traveling, idle, delayed, incident)
- Pending tasks (e.g., accident follow‑ups)
- Mini‐map overview of fleet locations
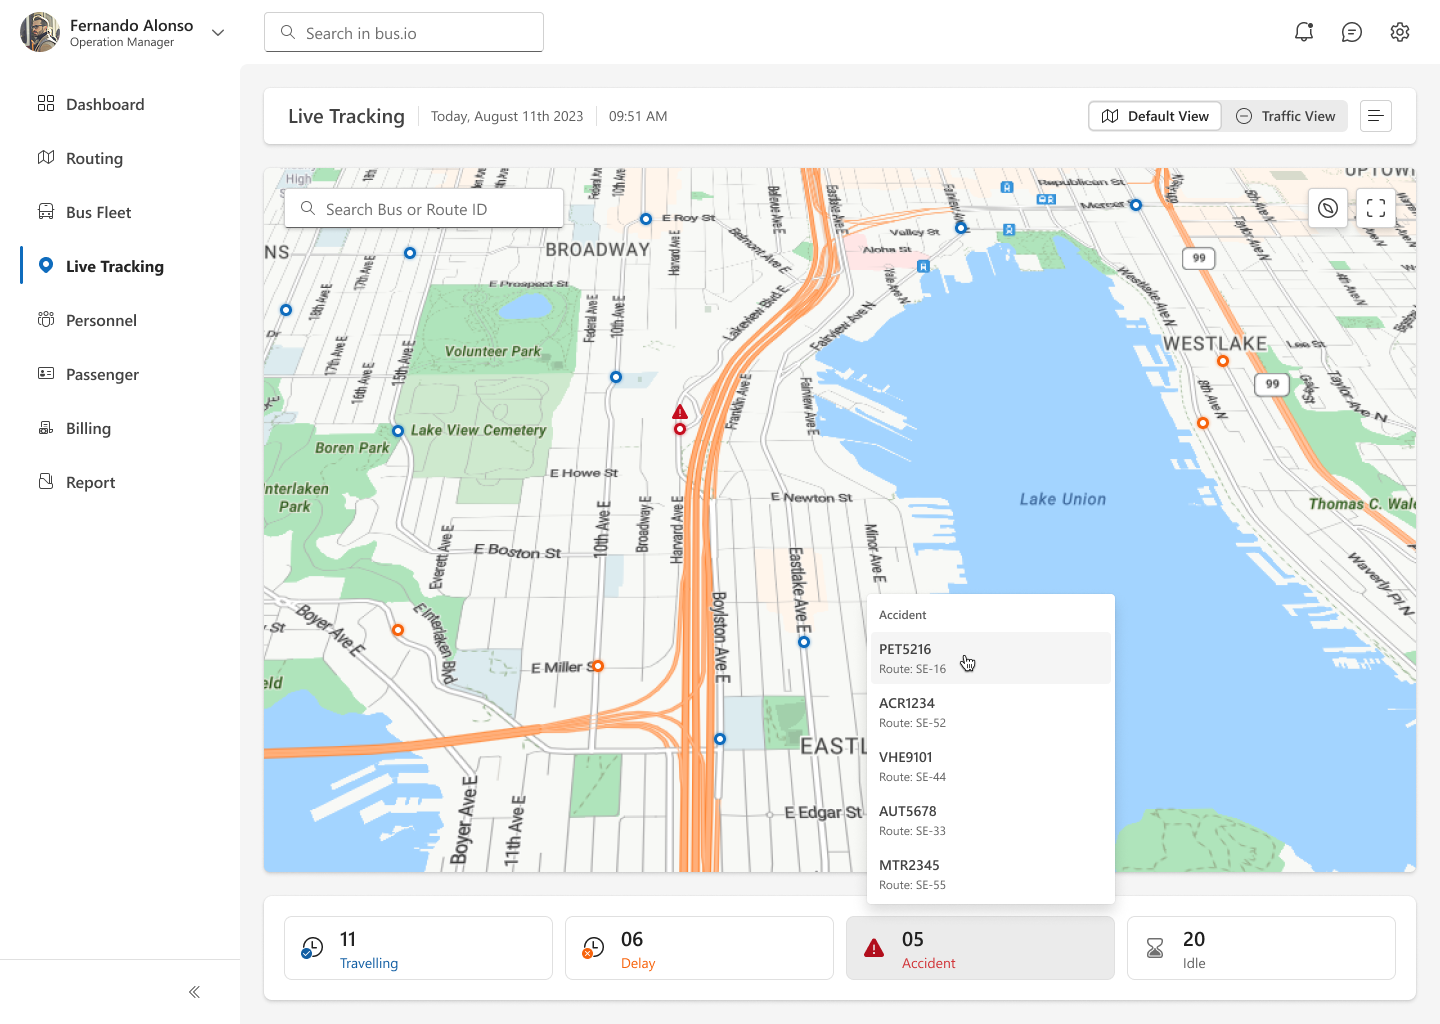
B. Live Tracking Flow
- Fleet Map
- Indicating cards for buses by status:
- Traveling
- Delayed
- Incident
- Idle
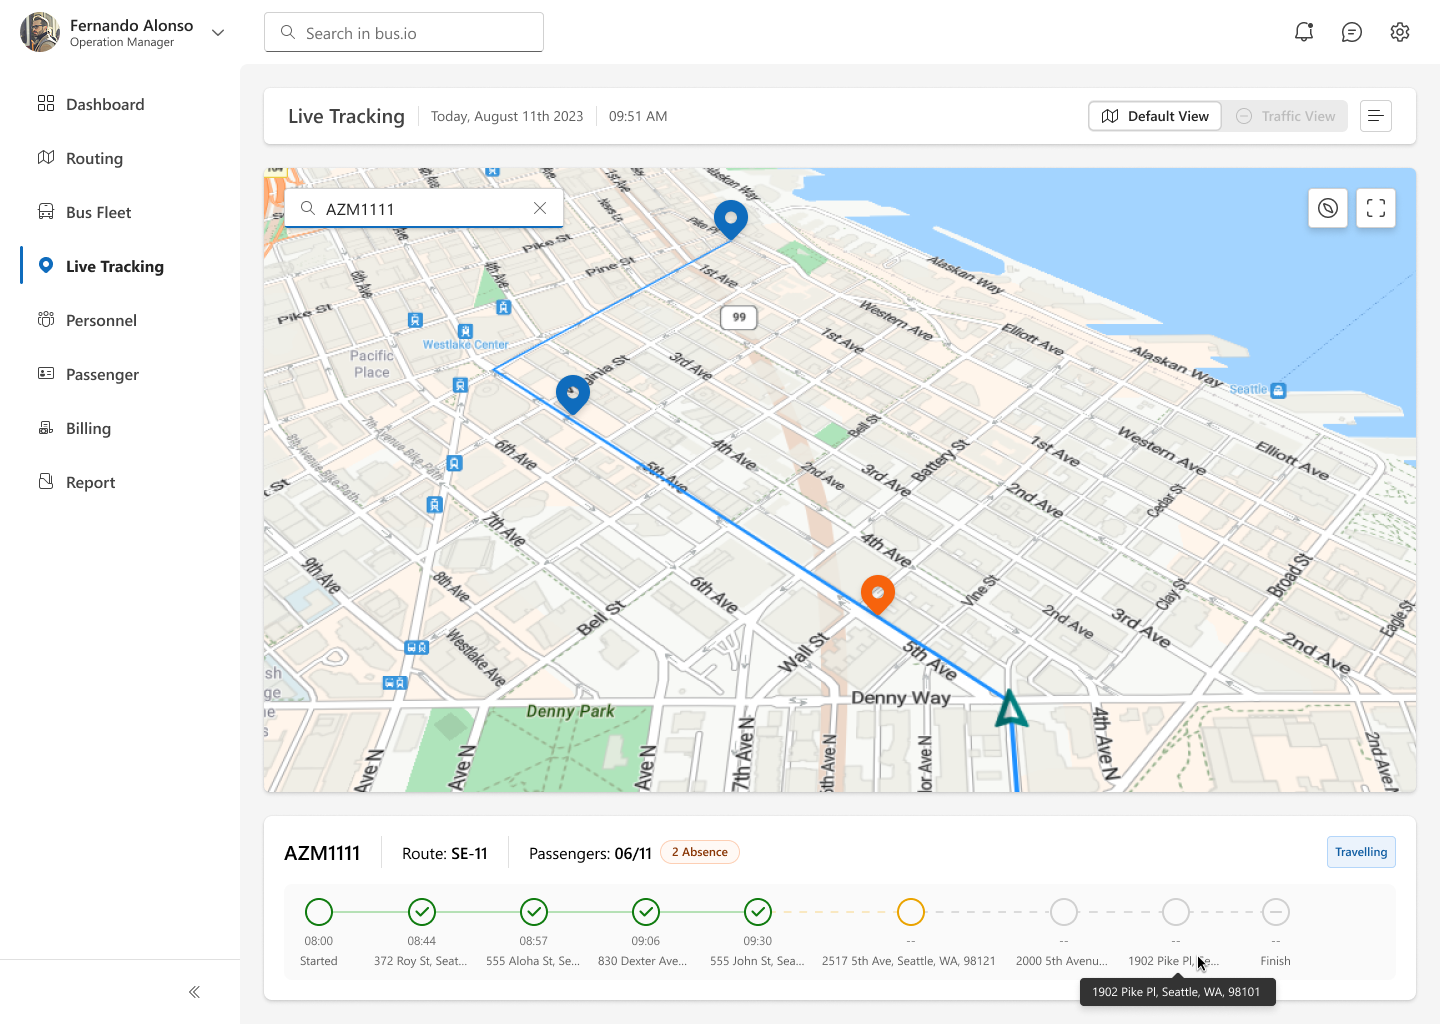
- Search field to jump to a specific bus plate (Search by bus plate or bus route)
- Indicating cards for buses by status:
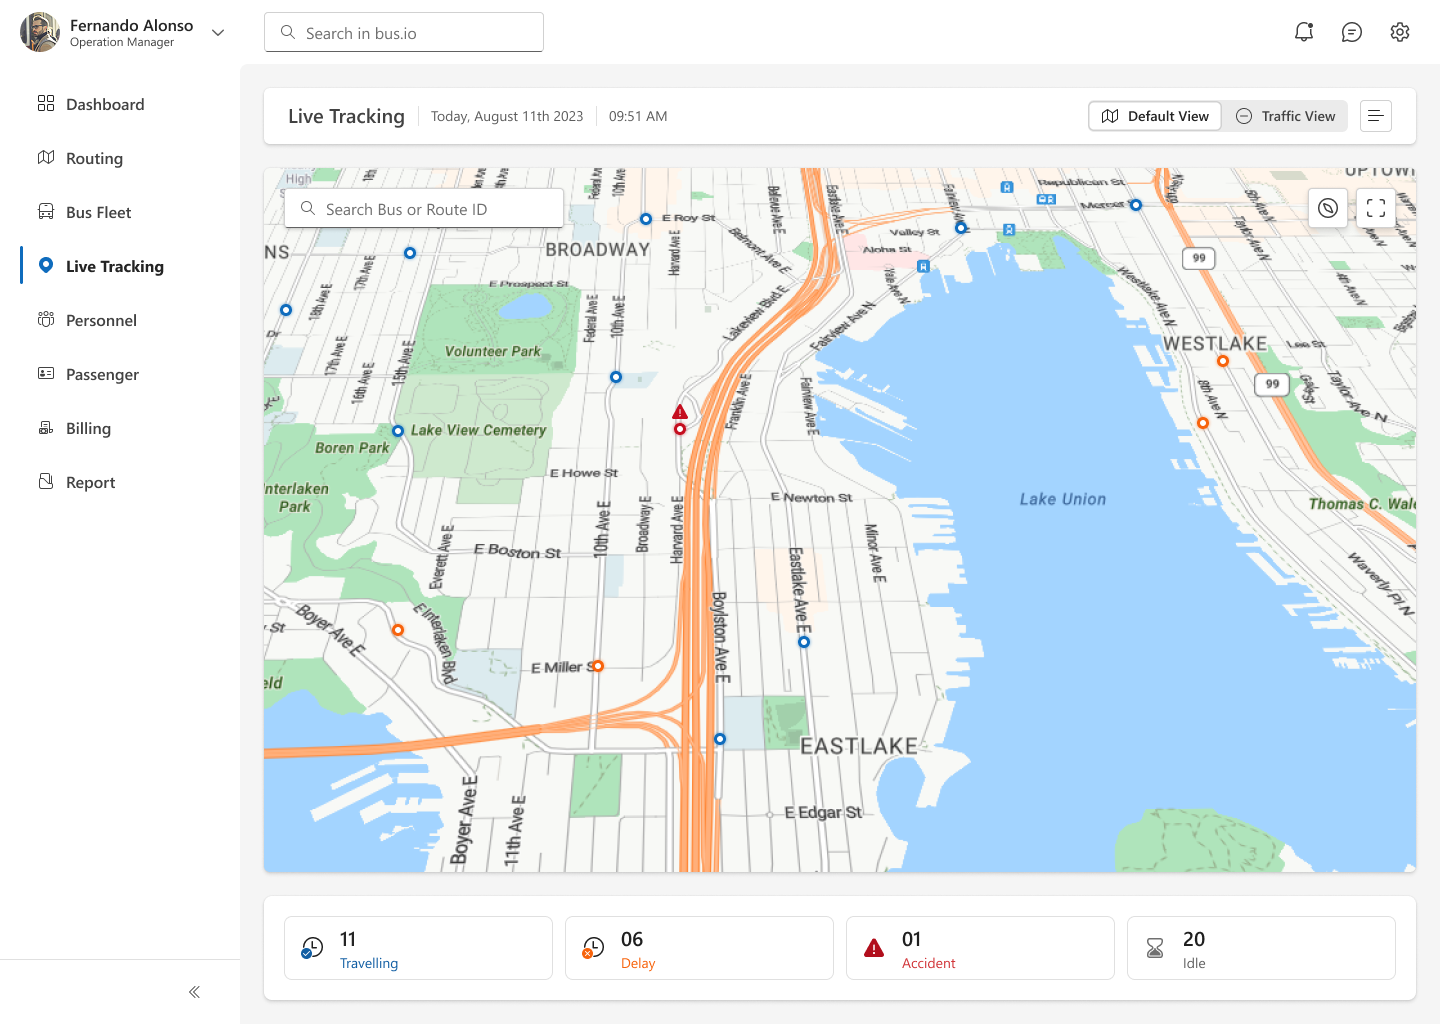
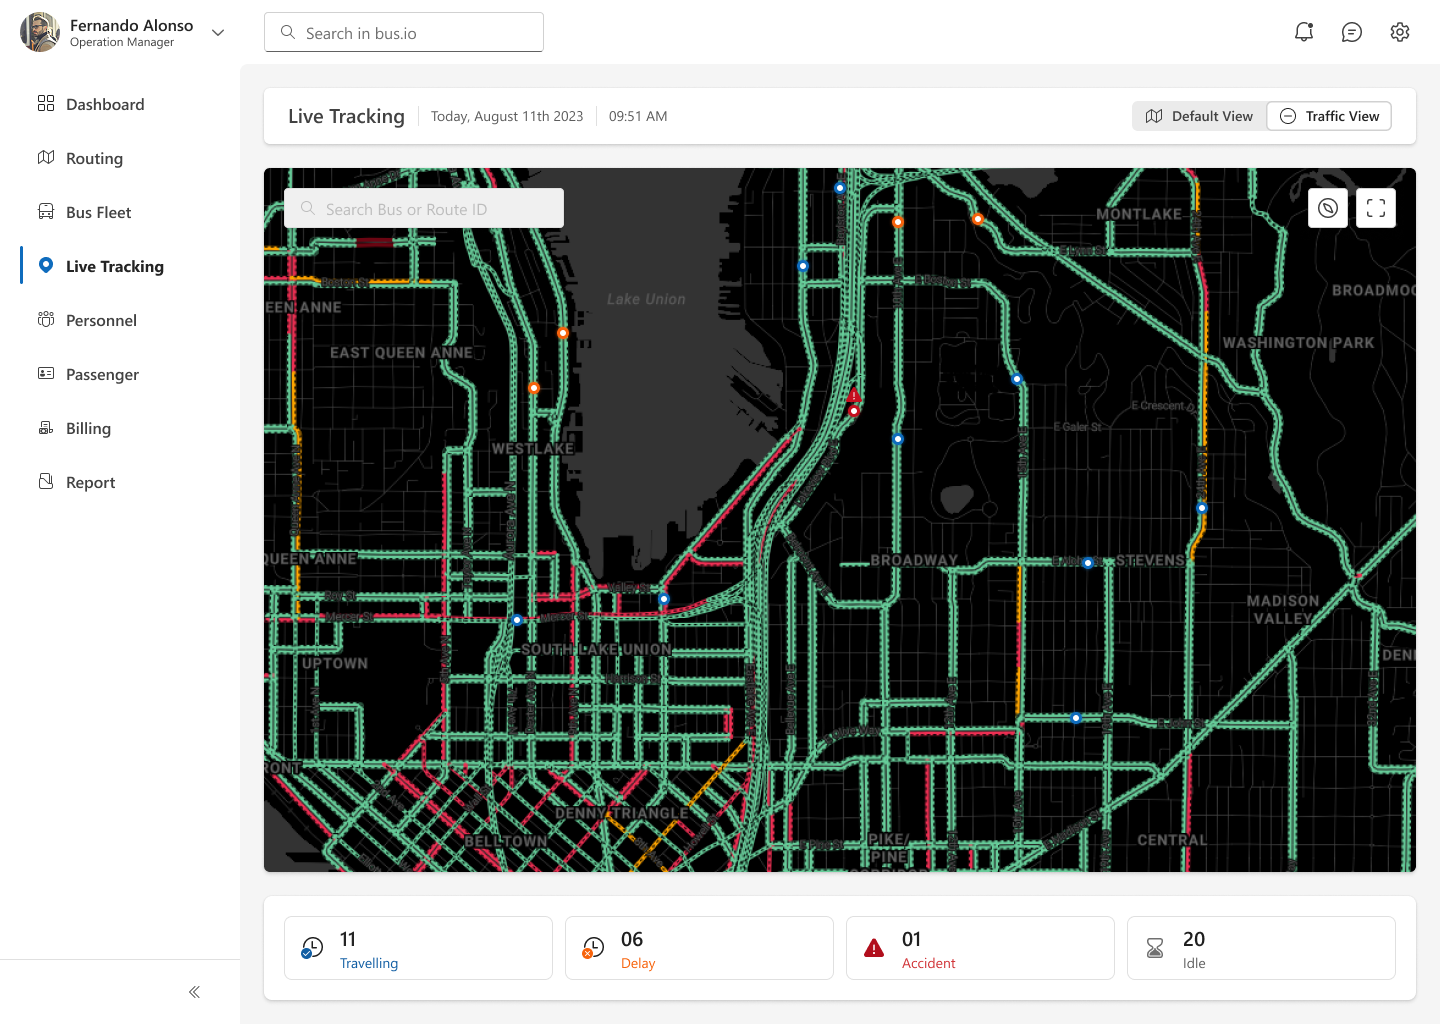
- Traffic Overlay Toggle
- Live road congestion heatmap
- Suggest alternate routes to drivers
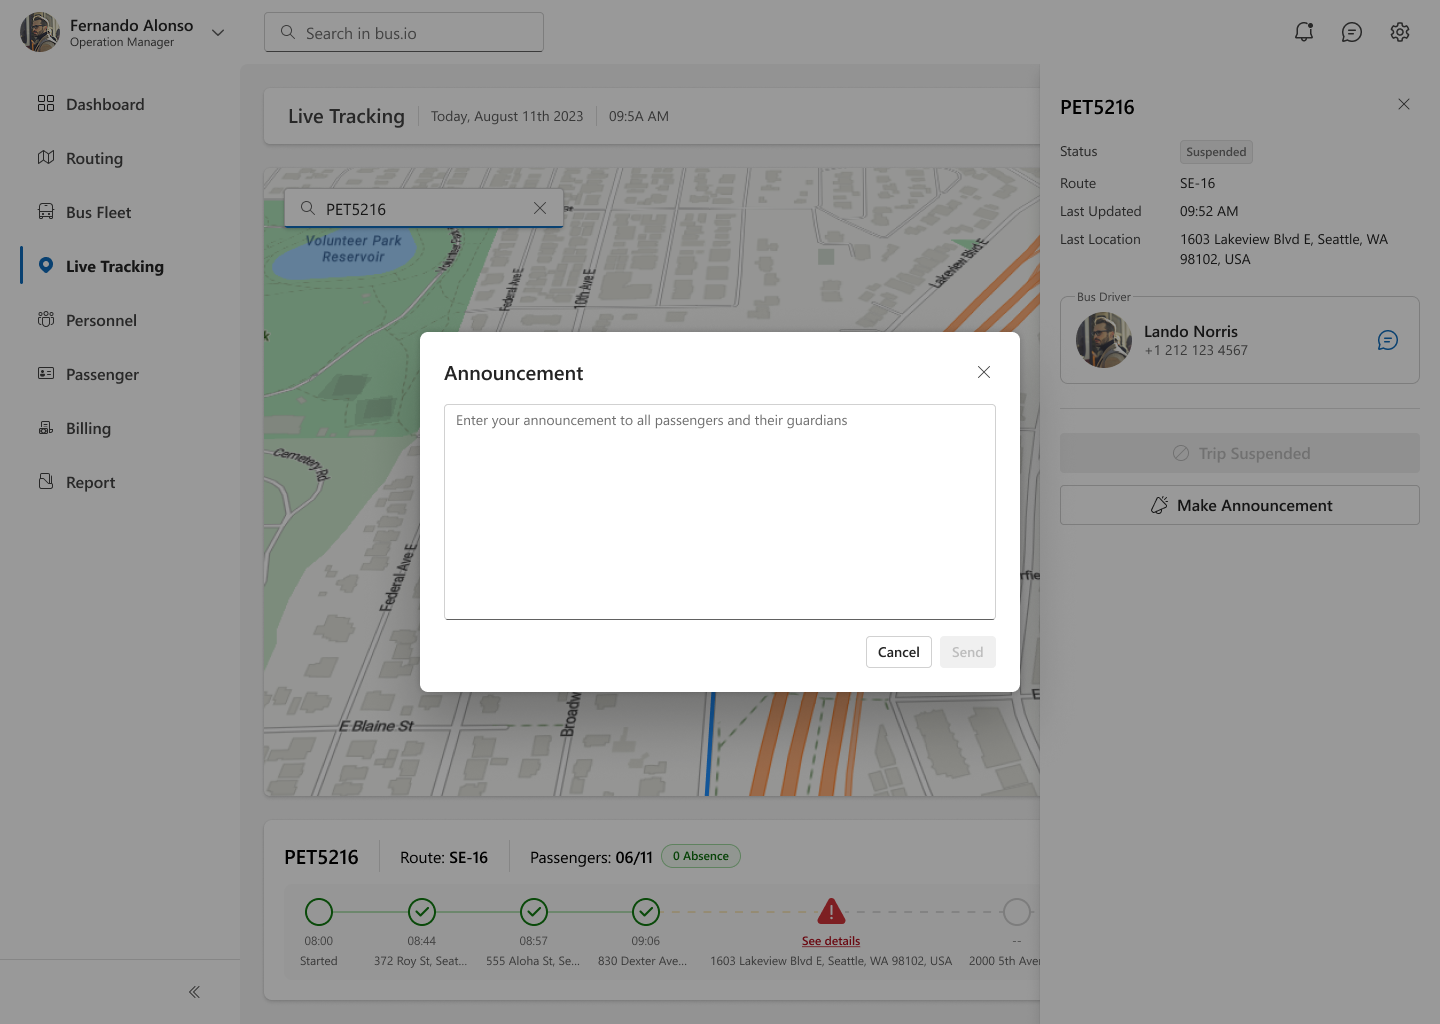
C. Incident Handling Flow
- Incident Summary Card
- “3 buses in accident” badge
- Click to open list
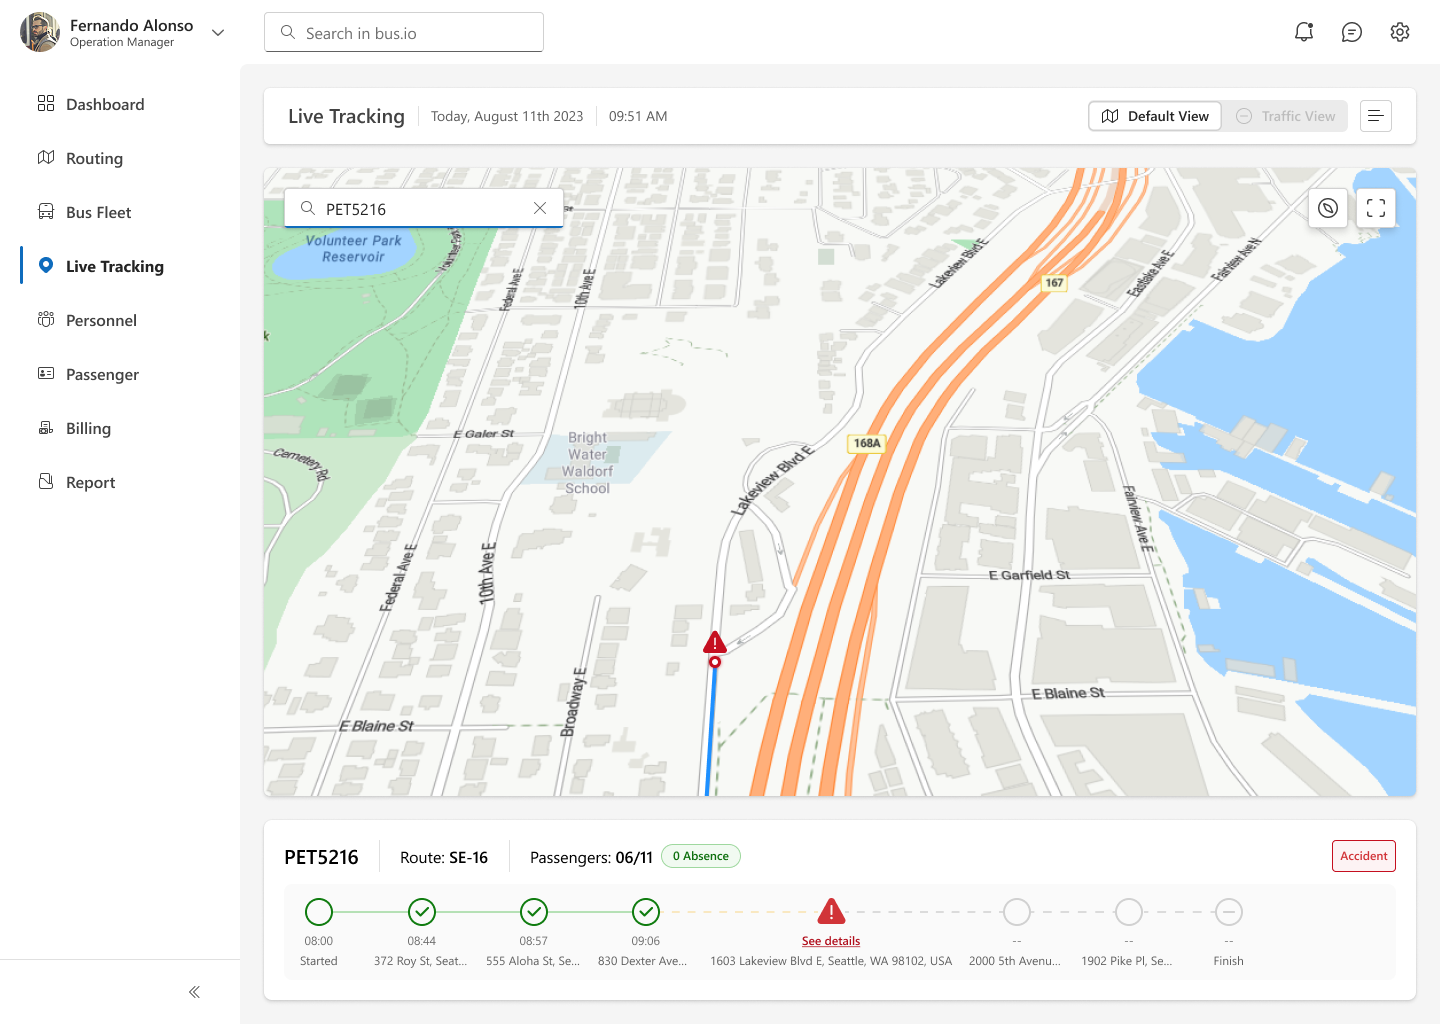
- Detail View for Selected Bus
- Map zoomed to bus location
- Driver’s submitted report (photos + notes)
- Timestamp & passenger count at moment of incident
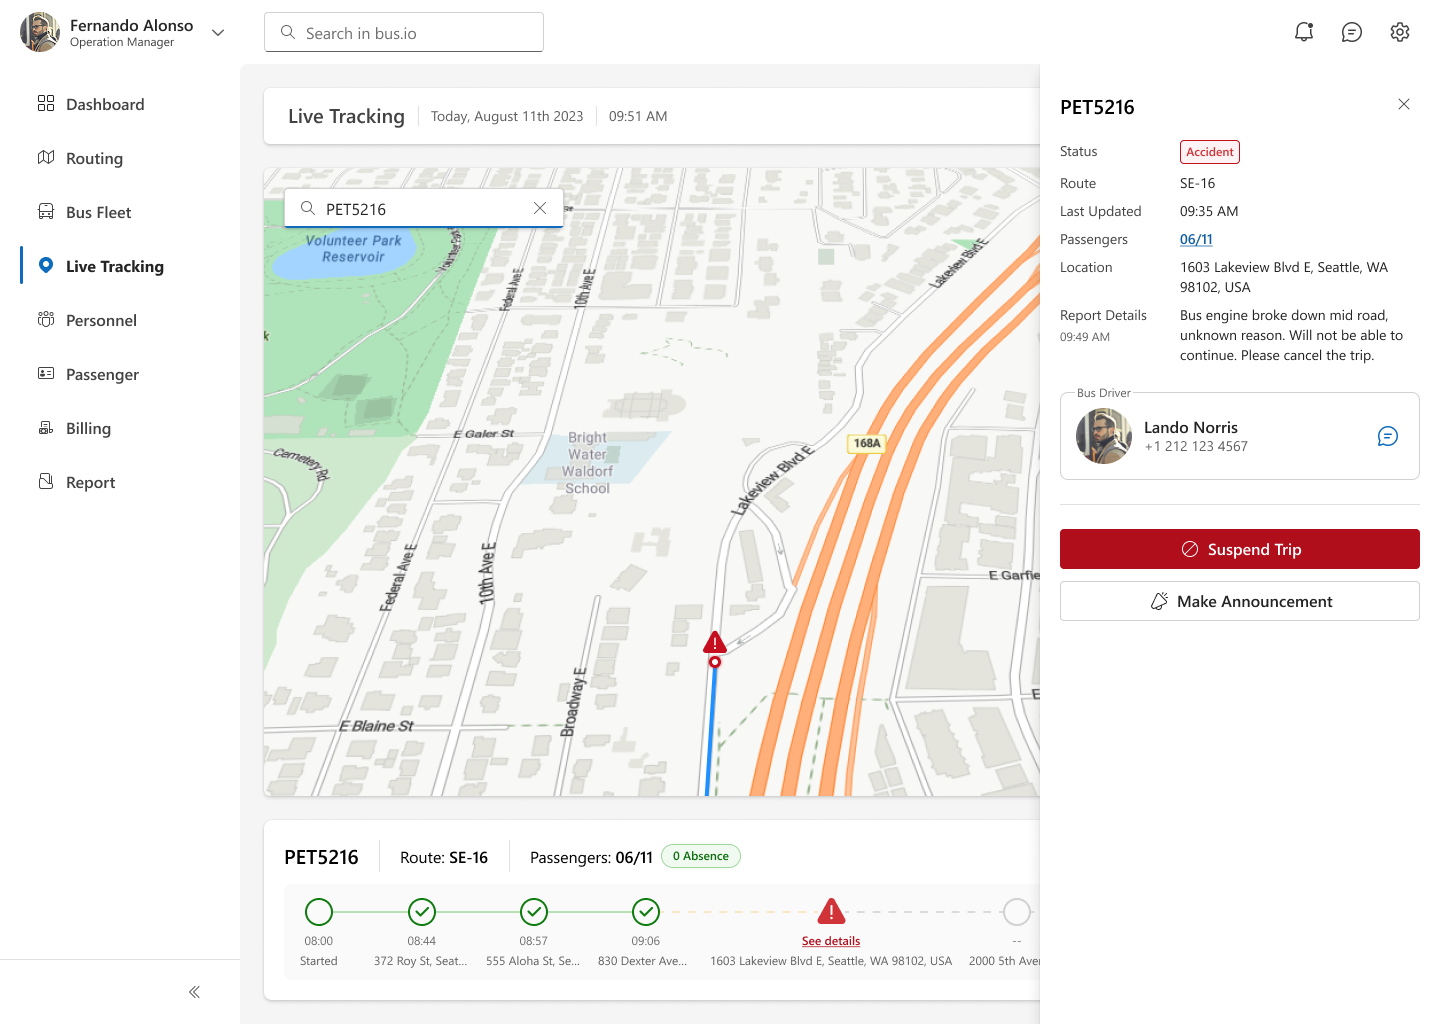
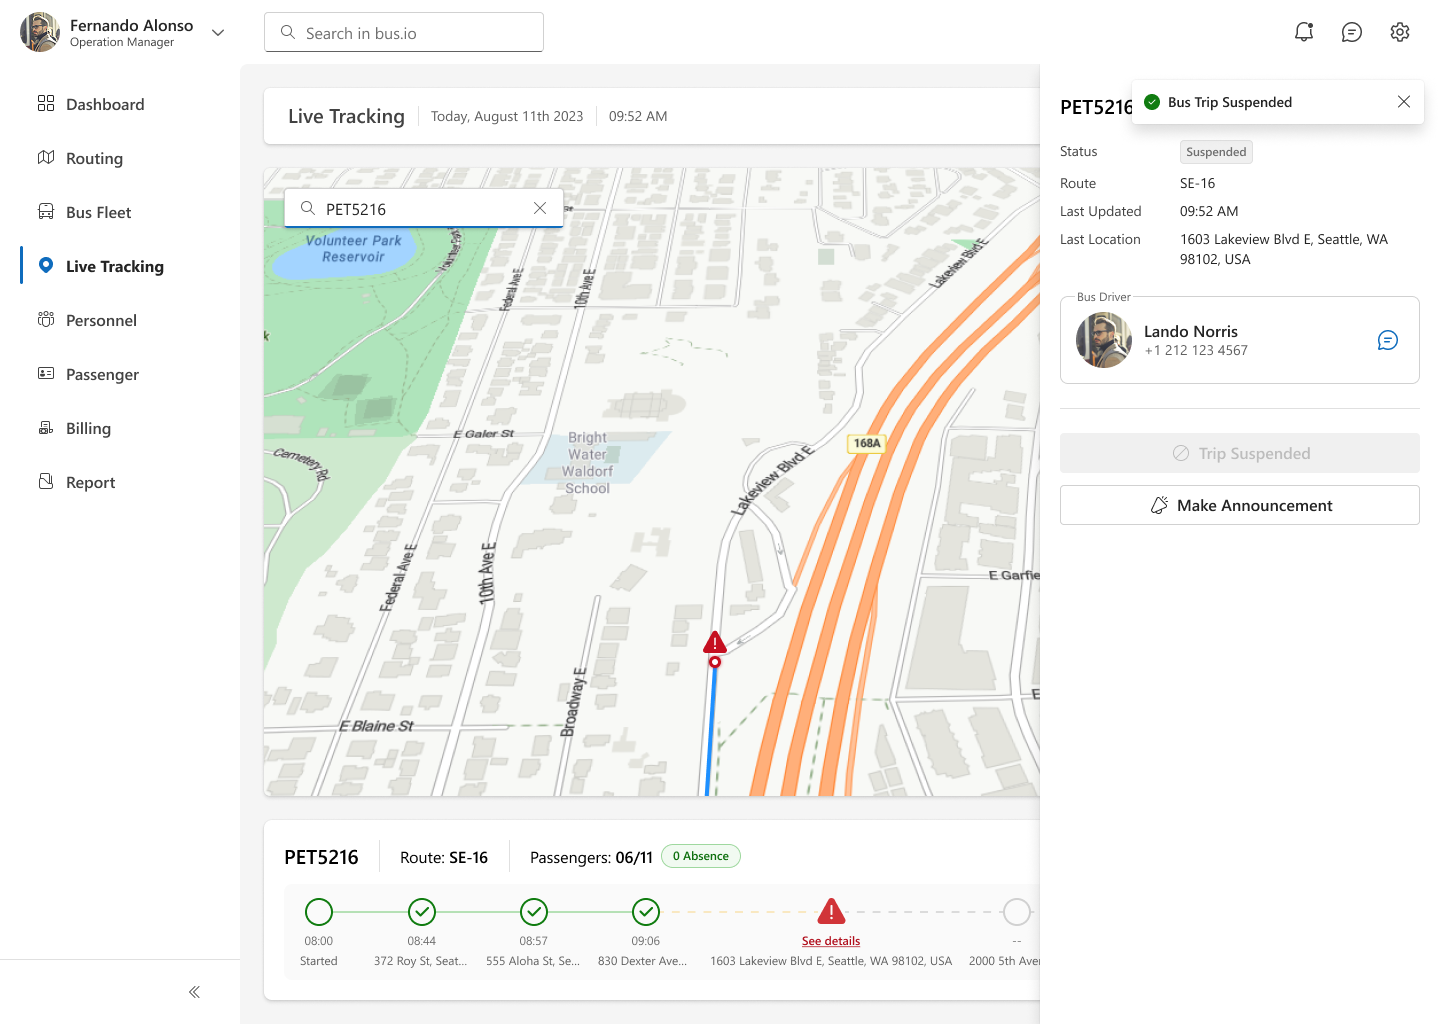
- Taking Actions
- 💬 Message driver (in‑app chat)
- ⏸️ Suspend trip button
- 📢 Broadcast announcement (to affected passengers & parents)
Results
After testing the clients reported:
- 🚀 85% reduction in average incident‑to‑response time (from 20 min → 3 min)
- 👍 97% dispatcher satisfaction rating in post‑launch survey
- 🔍 100% adoption by all regional offices in Singapore within 2 weeks
“We’ve never been so confident in our fleet’s safety. Our teams love the new visibility.”
—Singapore Branch Operations Director